Role of Ultrasound, Elastography, and Ultrasound Fat Quantification in Fatty Liver, MASLD, Noon Conference with Dr. Alka Singhal (7-3-25)
HIDEInteractive Transcript
0:02
Hello and welcome to Noon Conference, hosted by modality
0:05
Noon Conference connects the global radiology community
0:08
through free live educational webinars that are accessible
0:11
for all and is an opportunity
0:13
to learn alongside top radiologists from around the world.
0:16
You can access the recording of today's conference
0:18
and previous noon conferences by creating a free account.
0:22
Today we are so honored to welcome back
0:24
to the noom conference stage Dr.
0:26
Alka Singal for a lecture entitled role
0:28
of ultrasound elastography
0:31
and ultrasound fat quantification in fatty Liver.
0:34
Dr. Singal is an associate director of radiology at Madonna,
0:37
me City Hospital Deli, NCR India,
0:41
and has over 28 years of experience in radiology.
0:44
She's authored several publications
0:46
and talks for leading national and international conferences
0:49
and is the author of Atlas of Parathyroid ultrasound.
0:53
At the end of the lecture, please join her in a q
0:54
and A session where she will address questions you may have
0:57
on today's topic.
0:59
Please remember to put your questions into that q
1:01
and A feature so we can get to as many as we can
1:04
before our time is up.
1:05
With that, we're ready to begin today's lecture. Dr.
1:08
Singal, please take it from here.
1:10
Great, thank you so much. Thank you for inviting me.
1:14
And so today's topic is Advanced liver imaging,
1:18
so UDFF and ultrasound elastic.
1:21
So both, both the two things are a little bit different.
1:25
They are different modalities
1:27
and they are pretty much,
1:29
the good part is they're both available in the advanced
1:32
ultrasound equipment
1:34
and they're both often available within the same transducer.
1:38
So if you upgrade your current ultrasound machine
1:40
or if you have it currently,
1:43
so UDFF is ultrasound derived fat fraction of the liver
1:47
and the liver graph is the stiffness of the liver.
1:52
So over a period of time as we grew up in our residency,
1:55
we've been looking at focal hepatic lesions
1:58
and what are the cystic or neoplastic or metastatic
2:03
or calcifications and biliary tract and the pathologies.
2:07
But per se, looking at the diffuse paradigm
2:10
of the liver has really taken a leaps and leaps
2:14
and leap in the diagnostic imaging modality now.
2:17
So currently we have the best cap equipment capabilities
2:21
to really give a very early diagnosis to the TRA ion
2:25
and also to see how much of
2:28
that heart has already deposited causing metabolic
2:32
and then fibrotic changes leading to stiffness of the liver.
2:36
Let's see, so, um, M-A-S-L-D
2:41
as we all know, is the term it's called as me
2:45
metabolic dysfunction associated stenotic liver disease.
2:48
So, which was earlier called as fatty, uh, liver disease
2:53
or N-E-F-L-D, like non-alcoholic liver disease, right?
2:59
So basically as our understanding it spans, we understand
3:03
that it, it's basically a metabolic
3:06
phenomenon which is causing increased fat
3:08
to be deposited in the liver
3:10
and beyond a certain point it will lead
3:13
to fibrotic inflammation and fibrotic changes in the cells.
3:17
So if we can catch it very early, we can catch,
3:20
quantify the amount of fat and really give an estimate
3:24
and maybe adopt changes.
3:26
So we reverse the process.
3:29
If it goes to stiffness process, then again we can grade it
3:33
and reverse the process
3:34
before it goes to the end stage phenomenon.
3:37
So as we all know, MAs, LD is one of the most common forms
3:42
of chronic liver disease
3:43
and definitely it is often seen more in pre obesity
3:48
and in type two diabetes
3:50
and global estimates, approximately 30% worldwide,
3:55
uh, population is affected by it.
3:58
So obviously without treatment this will lead
4:00
to severe liver diseases as I explained.
4:03
And so our intention of the elevated diagnostic mortality,
4:07
the advanced modalities, is to give an early diagnosis
4:10
and the early treatment which can,
4:14
uh, prevent it.
4:16
Okay? Now, so level reading has always been
4:20
for ultrasound physicians, a very subjective phenomena,
4:24
a very subjective phenomena is very good.
4:26
It's just easy. It's by the experience of the person.
4:29
Yes, there are defined landmarks that we observe
4:33
and so we, um, uh, we have to still go
4:38
by the guidelines.
4:39
However, it's a subjective integration
4:42
and assessment by the person
4:45
and it could also be varied by the subjective, uh,
4:49
the machine settings
4:50
and the understanding of the gain parameters
4:53
and other factors.
4:56
So however we will quantify it so
5:00
that we dissolve the discrepancies
5:03
and we give a number to it, which can be
5:06
comparable from machine to machine operator to operator
5:10
or institute to institute
5:12
and over a various timeline as well.
5:15
So as we all know,
5:16
higher grades inclu indicate increasing liver brightness
5:20
and poorer visualization,
5:21
and the bright liver is more of a fatty liver.
5:24
Right Now, what are the factors
5:26
that we consider in that diagnosis?
5:28
Is a liver to kidney contrast different in echogenicity
5:31
between the liver and the
5:36
difference in the echogenicity between the liver
5:38
and the kidney and the, whether we are able
5:40
to see the diaphragm or not, um, whether we are able
5:44
to see the diaphragm or not.
5:45
And, and
5:47
how is the portal vein definition going second.
5:51
Okay, you right. So let's see. So what is grade one?
5:56
As we all know, it's the diffuse increase in genicity,
6:00
but the periportal
6:01
and diaphragmatic e echogenicity is still appreciable.
6:03
We look at the images soon.
6:05
Grade two is diffusely increased hepatic epigenesis,
6:08
which is obscure in the periportal genicity.
6:10
However, we can still see the diaphragm behind, right?
6:14
It can, we can still appreciate what is the posterior,
6:17
the boundary of the liver, right?
6:19
Grade three is increased echogenicity, which is obscuring
6:23
for the periportal region as well
6:25
as the diaphragmatic echogenicity.
6:27
Simple. So grade one, grade two periportal is also obscured.
6:31
And grade three, even the diaphragmatic surface is obscure.
6:35
So grade zero is normal, right?
6:37
So it's similar to liver, right? So it's the same thing.
6:41
Good visualization of diaphragmatic vessels
6:43
and this, so let's look at the pictures.
6:46
So in the normal liver we can very well see. Mm-hmm.
6:51
So in the normal liver we can very well see the uh,
6:56
kidney and the uh, genic periportal traps, right?
7:01
However, um, the uh,
7:04
and we can see the hypergo walls, uh,
7:06
the high hypergo walls in the portal in branches
7:09
and in grade one
7:11
that I promise seen there is a periportal
7:13
genicity still present.
7:15
And this background diffusely increased echogenicity
7:18
of the liver as we can very well appreciate here.
7:23
And so similarly here we can see there's a increase
7:28
the contrast, the echogenicity that we can appreciate coming
7:33
to what happens in grade two.
7:35
Now, so the hyperbaric war in the portal,
7:38
brain punches are seen in the normal liver.
7:40
However, there is loss
7:42
of this periportal echogenicity in case of grade two, he,
7:47
uh, fatty liver, right?
7:49
So this periportal echogenicity is lost.
7:52
That means this is appearing like a, a hyper area
7:56
and of course the background genicity
7:58
of the liver is increased, right?
8:00
Coming to the next, the grade three.
8:04
Now here what's happening is
8:06
the diaphragm is very subtly visualized.
8:09
We cannot really appreciate the posterior margin,
8:11
the diaphragm right here.
8:13
So what happens in grade three?
8:15
There's a marked increase in echogenicity,
8:17
which is making the liver much
8:18
more brighter than the kidneys.
8:20
And there's poor seco texture of course,
8:22
of the background parenchyma.
8:24
And there's poor visualization of the hepatic vessels
8:27
and the diaphragmatic surface is not very,
8:30
that's grade three, okay?
8:34
Right? So again, another example.
8:36
So very echogenic liver and obscured portal vein branches
8:40
and of course limited visualization of the do of diaphragm.
8:44
Easy, simple. Okay?
8:47
Now with that, now let's understand
8:50
what is UDFF ultrasound, right?
8:52
Fat fraction. So A SF uh, ma, uh, metabolic associated
8:58
TIC liver disease is the most common cause of CLD globally.
9:02
So 20 to 30% of the people will progress to a meh diagnosis
9:07
and which is hepatitis
9:08
and which will lead to fibrosis,
9:11
cirrhosis, and liver failure.
9:13
So what's our intention here is to give an early diagnosis,
9:17
quantify it, and then it can be managed
9:19
and followed up as well.
9:22
Now this is the reference literature.
9:25
Now what is happening is we were doing it, uh,
9:30
subjective grade one, grade two, grade three.
9:33
Now we, uh, and which are difficult to understand.
9:37
So we come to the solution of ultrasound, right fraction,
9:41
which is fast, simple
9:44
and very, uh, it's very precise
9:47
and it's very good even for patient counseling
9:50
and convincing and follow up as well.
9:54
So it exam time is less than a minute as what Siemens says.
9:58
However, basically in five
10:00
to 10 minutes you would less than five minutes,
10:02
you can finish the scan.
10:03
So you can have a index
10:06
of value greater than 5% delivering a clinical
10:10
similar clinical utility as MR.
10:13
Fat estimation. So how do we grade it now?
10:18
So basically you can,
10:20
you do it using the DS curve transducer.
10:23
So this measures a fat fraction
10:25
or the fat content in the level, right?
10:28
And we record the median value
10:31
validate from five validated site, right?
10:34
So validated site is again, we try
10:36
and avoid the uh, sampling.
10:39
We basically want to see the in the fat pen grammar, right?
10:43
So when you're placing a cursor, we have
10:45
to keep it away from the capsule,
10:46
away from the blood vessels,
10:48
away from the portu brain branches.
10:50
So we want to just sample absolutely the per right?
10:54
So which is a bit, which will give us uh, the normal liver,
10:58
the fat component is less than 5%,
11:01
which is grade zero or healthy.
11:04
So between five to 20% is mild,
11:08
or actually this is a little more, um, intense grade.
11:11
Practically between five to 10% I would say is mild
11:16
and 10 to 15 is moderate
11:18
and more than 15 kind of let's let say compare grade three.
11:22
Okay? So these numbers are
11:25
need require requiring correction.
11:28
Now, so we go for, I go
11:31
with this classification, which is what is here.
11:34
So more than 5% for mild, which is rate one
11:37
and more than between five to 10% is grade two
11:40
or moderate, okay?
11:43
And then more than 15% is grade three, right?
11:48
So this is grade three.
11:50
So the optimal threshold for UDF is
11:52
to remind us more than six,
11:54
6% first grade one more than 15%, grade two
11:58
or more than 53% for grade three.
12:00
But if you go by subjective um, analysis, the
12:05
the appearances, the numbers will probably come even at
12:08
15 to 20%.
12:11
So this is a very good tool
12:14
and which gives a very instant, quick estimate.
12:20
So just in the measurement there's a control animation
12:23
parameter, which is uh, the technology which is behind it
12:28
that uses the fiber, uh, measures this.
12:32
So, uh, it's measures the attenuation
12:35
of the ultrasound waves as they pass through the liver
12:37
and the higher cap values indicating greater value of
12:42
fat accumulation, right?
12:44
And it is measured in decimals per meter. Okay?
12:49
Right? So let's look at some cases for the UDFF.
12:53
So here's an ultrasound
12:55
and we have the corresponding uh, images.
12:58
So here as we can see,
12:59
we can see very nice port vein verticals.
13:02
We can see nice to diaphragm.
13:03
Nice, nice, nice, all looking good.
13:06
And look at the uh, fraction here.
13:09
Fat fraction is coming to us 3%.
13:12
Can you see this number here? This is 3% here.
13:15
Okay, so here the number is four, right?
13:19
So this is 4%, this is again 4%.
13:21
So we will take random, at least five samples
13:24
and then we will the cal, the median
13:28
of course this is done with breath holding.
13:30
Patient is preferably with fasting at least stood four hours
13:34
to avoid the gases and we sample the right clo.
13:38
Now again, another case,
13:40
this is patient has a bit of sitis here.
13:42
So we are trying to uh, sample here.
13:46
Um, and we see that the fat value is 3% here,
13:51
3% here, 3% here,
13:54
2% here, 3% here.
13:57
So again, these are all less than 5%.
14:00
So it's grade zero
14:01
or the, so this is again just a recap.
14:06
So this is again grade one fatty liver.
14:08
Now we see a little bit of blurring of the uh, periportal.
14:12
Uh, we see a little bit muffled margins.
14:16
So there's loss of echogenicity,
14:17
however, we can still see the diaphragm very well.
14:20
So this, now we've done the corresponding
14:25
images for the UDFF and this is the same patient
14:29
and the same patient scan.
14:31
So it's the same data, same patient.
14:33
These both these patients are same, right?
14:36
Both these belong to the same patient. So the values is 8%.
14:41
Here again, at this site also is, it's 8%, right?
14:45
So 8% for this, right?
14:47
So between five to eight we have grade one pat label.
14:51
Again, this is an same patient.
14:53
So we have the value, which is 12 here.
14:56
So which is like the upper limit of grade coming
15:01
to the next we have grade two,
15:04
so which is got a increased echogenicity here
15:07
and the values are, this one's 29,
15:10
which is significantly quite high though.
15:13
And another one which is um, uh, again,
15:17
which is probably looks like a little bit
15:19
of stiffness as well.
15:20
Probably again,
15:22
this is also pretty much high 29 and three three.
15:26
So this is grade two, grade two, grade two loss
15:31
and kind of doom is well seen, which is up
15:34
to UDFF values going up to 30%, coming
15:38
to the another one, grade two to three you can call it.
15:41
So again, the values are 29, 30% or 26%.
15:47
So very easy, simple test to do
15:49
and gets a great inflammation.
15:51
Now we have also got, um, an uh, a sample
15:56
that's will take multiple images at the same time.
16:00
So it has got 1, 2, 3, 4, 5, 1, 2, 3, 4, 5, 5, 15.
16:06
So basis of the number of dots that you have that will show
16:09
that how much is it, um, aligned
16:13
or how much is the margin of error, right?
16:16
Simple. So if you have more number of dots like five
16:20
or selected, that means you are in good, good alignment
16:24
and good breath holding and you're doing it more accurately.
16:28
So with that technology, we can uh,
16:33
do it and the cutoffs are 5%, 10%
16:36
or 15% for moderate, mild, moderate and severe.
16:40
And it's a very reliable modality. We look at more cases.
16:45
So if we have caught the patient at this level
16:49
of fatty liver disease done the UDFF patient's managed well,
16:53
great, if patient hasn't,
16:55
and it's left untreated, are unmanaged for a long period
16:58
of time, obviously, as we all know, progresses
17:01
to chronic liver disease, right?
17:03
So in chronic liver disease, what happens, as we all know,
17:07
there is a progressive deterioration of liver function.
17:10
So basically, uh, all the metabolic function,
17:13
there's continuous uh, inflammation,
17:15
then there's destruction
17:16
and regeneration of pan chima leading to fibrosis
17:20
and cirrhosis, right?
17:21
And cirrhosis is the final stage of the, which is going to
17:26
lead to widespread nodules, maybe neo, neo angiogenesis
17:31
and others.
17:33
Right? Now of course there is a lot of etiology, pathology
17:38
and all these things that goes on to explain.
17:42
And the incidence of CLD is very high.
17:44
It leads to a large number of transplant work
17:47
that we do at my institute where I work.
17:50
So what can we do?
17:53
Be aware of the geologies early diagnosis and prevention.
17:57
Alcohol, as we know is one
17:58
of the very common, uh, this thing.
18:00
And the other one is the metabolic diabetes
18:04
and infections, chronic hepatitis
18:07
and of course other uh, uh,
18:11
l less common spectrum of genetic causes
18:15
of enzyme deficiencies and others.
18:17
And autoimmune primary ary sclerosis, sclerosis,
18:22
cholangitis or autoimmune, he and ING can have drugs
18:26
but carry and those idiopathic.
18:28
So there's a long list of causes, right?
18:31
Definitely many are preventable, right?
18:33
However, all need to be managed all need to be quantified
18:38
as term of pathology
18:40
or we need to get a value of the ELA gap
18:42
or the stiffness of the lipkin, right, to be able to manage.
18:47
So we all understand that if we leave it there,
18:50
it'll progress to hepatitis, fibrosis,
18:52
cirrhosis and liver failure.
18:54
Hepatitis is inflammation. So inflammation happens.
18:58
A lot of fat is deposited or stiffness in inflamed
19:01
and then healing, inflame healing, inflamed healing
19:05
fibrosis, right?
19:06
Once there is fibrosis,
19:08
then fibrosis is not a functional tissue, right?
19:11
So obviously the functional pan component
19:14
of the cells goes down.
19:16
So liver function goes down
19:18
and lots of um, process
19:23
of all the collaterals and everything ensures, right?
19:27
So what is fibrosis?
19:28
It's basically stiffening of the liver as the thin bends
19:32
of the scar tissue gradually add up, right?
19:35
Okay, so this is what happens.
19:36
The scar tissue reduces the blood flow through the liver,
19:39
which reduces its its oxygen and nutrients.
19:43
And this is how the liver's vitality, right?
19:46
It's life begins to gradually decline.
19:50
Remarkably, some amount
19:51
of fibrosis is definitely reversible.
19:54
Uh, however, if it, it is ens.
19:59
So cirrhosis as we know will not be able to recover.
20:03
So liver failure begins when the liver can no longer
20:06
function adequately for the body's knee
20:07
and it, you can in originally have a decompensated cirrhosis
20:12
and of course as the liver functions begin to break down
20:15
that it effect throughout the body
20:17
and it is a gradual process
20:20
and eventually it is fatal without any liver transplant.
20:24
And one does need a liver to live, right?
20:26
So then they end up in transplant.
20:29
But we want to prevent that.
20:31
We can see and diagnose early clinically.
20:34
However, there is a big overlap of symptoms with fatty liver
20:39
and GIT upset.
20:41
So these symptoms can be weak for abdominal pain,
20:46
nausea, loss of appetite, fatigue or MA soap.
20:50
We need a, uh, we have other diagnosis
20:53
of advanced stage which are jaundice
20:55
and uh, basically these are complications due
20:59
to complications of hepatic failure, right?
21:02
So which are jaundice tackle, urine tackle,
21:05
light colored stool
21:07
because of ary,
21:08
while not pain there digest difficulties
21:11
especially with fats.
21:12
Weight loss and muscle loss, musty smelling, right?
21:15
Mild brain impairment, middle brain, mild brain impairment,
21:19
atic encephalopathy, pruritus which is skin
21:21
with no visible rash, right?
21:25
So if we can diagnose by spoony, Terry, knee clubbing,
21:30
spider tumors, easy bleeding and all those features
21:34
and we can have swollen ankles, feeds and other carriages
21:38
and of course it'll lead to liver transplant.
21:41
We can have collaterals, pre hepatic pulmonary syndrome,
21:45
HEPA syndrome, hypers,
21:47
and various complications due to that.
21:51
So what are we going to do?
21:53
Now we understand that if left untreated the spectrum
21:58
of the clinical picture, all that the patient's going
22:01
to three is a huge one, right?
22:03
We want to prevent that, we want to catch it early.
22:07
So another good tool that we have is to do a
22:12
ELA of course.
22:14
How are we going to do it?
22:15
We need the patient in fast in state
22:18
and we for this, we will actually be using a position of
22:24
ERs and we will obviously do various other modality scan
22:28
as well to have a thorough view of the parenchyma
22:32
before we move on to the elastography problem.
22:37
So let's understand what is ultrasound elastic? Do we do it?
22:41
How do we do it? And what's the applications?
22:44
So it's a technique to assess the elasticity
22:46
of the stiffness of the tissues aiming
22:48
to give an insight similar
22:49
to palpation on clinical examination.
22:52
The technique is based on the changes in elasticity
22:54
of the soft tissues in response to the physiological
22:57
and pathological processes such as fibrosis, inflammation,
23:01
and neuro neovascularization.
23:04
So what happens is it provides complimentary information
23:07
to the BMO imaging and that can be measured
23:11
and documented both qualitatively and quantitatively.
23:16
So it's got a wide spectrum
23:17
of clinical applications in liver brace, thyroid, kidney,
23:20
prostate, lymph nodes, and
23:22
musculoskeletal ultrasound, right?
23:25
So as you all know, it's of two types.
23:27
One is qualitative, the compression elastic to gravity
23:30
where you have the different colors
23:31
and the codes and things like that.
23:34
And you have quantitative
23:35
where you get information in numbers, right?
23:39
Rv. So the, what is the principle,
23:42
the heterogeneous elements of the tissue,
23:44
they respond differently to the differences due
23:47
to differences in the elasticity
23:49
and are displayed in different colors on the skin.
23:52
So the qualitative changes, the structural pan
23:55
says using a color scale,
23:57
there's often you'll see a vertical bar which has colors
24:00
and it'll be written on one side.
24:02
If you read very finely, then we soft treat somewhere
24:05
and a hard written somewhere.
24:06
You know why it's important?
24:07
Because you can actually reverse the setting.
24:09
So you need to know how you are reading
24:11
and interpreting that information as well.
24:14
Okay? So the scale reflects the character stiffness
24:18
of the organ of the lesion that's being detected.
24:20
A stiffer tissue is displaced usually
24:22
as a color coded fit on the screen back convent,
24:25
however you can change it
24:27
and a more elastic tone is displayed in sheets of blue
24:30
and free easy.
24:33
So now, uh, as you all know,
24:37
elasticity images is easy, it's very comfortable
24:40
and you can easily assess and diagnose with confidence.
24:44
Right? Now we use a virtual
24:50
touch technique and it can give a pinpoint site if you want
24:54
to see the stiffer area that you want to sample,
24:57
that's an added advantage that you can get, right?
25:01
And we will, we use um,
25:05
ROI box of one millimeter, which we will just see.
25:11
So what happens is basically what's the
25:14
principle and what, how does it work?
25:15
There's a long wave push.
25:19
So the higher sheer wave speeds
25:21
and smaller displacement are associated
25:23
with stiffer tissues, right?
25:25
And slower sheer wave speeds
25:27
and larger displacement occur with more compliant tissues.
25:30
So the most stiffer the tissue higher the velocity they find
25:35
R images have special uh, special resolution comparable to
25:39
that P mode, often
25:40
with greater contrast providing matched
25:42
adjunctive information.
25:45
Okay? So the more so the more higher the velocity of the,
25:50
that is documented and recorded, right?
25:53
Okay, next is,
25:57
so like I said, this is the same pictor position.
26:00
We did the UDFF and we did the fatty liver, right?
26:04
And then now we are doing the ELA
26:08
to detect the fibro process
26:10
before it goes into frank cirrhosis, right?
26:16
Fatty liver disease we did right?
26:18
Major causes, we already covered.
26:21
Process of chronic liver disease we've covered
26:24
has got an overlap.
26:26
Now what is the gold standard test for diagnosis?
26:30
Of course it is the biopsy right now for biopsy,
26:34
always lesion and invasive procedure
26:36
and you cannot go on doing biopsy.
26:38
Maybe you can do it once,
26:39
but then uh, to see for the response
26:42
to treatment he wouldn't go on doing
26:44
redoing the biopsy, right?
26:45
So biopsy involve course sampling,
26:50
again at least five portal tracts
26:52
and sampling of more than 11 portal tracts is optimal.
26:56
And then each course, uh,
26:59
sample should be at least two centimeter long lip.
27:04
Now limitations, obviously it's an invasive,
27:07
you can have errors and hemo there.
27:11
Basically it's an invasive procedure.
27:14
So we come to the other uh,
27:18
technique which is our ultrasound probe,
27:20
which is going to do the RV.
27:23
Now it's one of the modalities to get the
27:27
liver stiffness.
27:29
So, and it'll give us a quantitative measurement.
27:34
Now, according to many studies, the higher the degree
27:36
of lesion stiffness revealed by asto response
27:39
to high probability of its malignant origin
27:43
or to the higher risk of its malignant potential.
27:46
Now this is the main area that we need to focus upon.
27:50
So if the values are higher, so we are looking at
27:54
increased risk of malignant potential, of course
27:59
that's the reference.
28:01
So how do we do it? Okay?
28:07
So what happens is we just uh, did the principles,
28:10
we will have the velocity, we've sent out a wave and the ROI
28:14
and the displacement happens and that velocity is added
28:18
and we get the velocity in centimeters per second.
28:22
And now the machine's directly calculated
28:25
and give it in a ki kilo basket as well.
28:28
However, there may be nomograms in chart,
28:30
you can manually calculate and convert it into that as well.
28:34
And we usually avoid the area very close to the capsule,
28:38
close to uh, closer to the blood vessels.
28:41
So we try and sample a plain area
28:44
of the per IDE serve, okay?
28:47
So the fibrotic livers are stiffer
28:49
and they move to greater decrease compared
28:51
to high velocity on lip, right?
28:55
So in that shell, what is the elastography provides,
28:59
it provides an information for the stiffness of the tissue.
29:02
It aids in a size assessment of the lesion.
29:05
Sometimes when you do color coding, right?
29:07
So the lesion margin sometimes the it could text your
29:12
appearance may still be similar,
29:14
but when you do the stiffness mapping, you see
29:16
that the lesion is far more than what is was visible to you.
29:21
Malign. These tend to be stiffer than benign
29:23
and often they may have a larger extension that is not
29:27
so visible due to altered architecture patterns.
29:31
And of course it can help identify ISO coic lesions
29:34
because they are not visible and be more imaging.
29:37
But when you apply the stiffness criteria that
29:40
with the stiffness filter, they may be detect it, right?
29:45
And of course they can help guide intervention, uh,
29:49
intervention biopsy procedures
29:51
by identifying stiffness areas without a lesion, right?
29:57
Right. So the little graph
29:59
and fibrosis assessment are conducted according
30:01
to the MIBI scale.
30:03
Now what is the MIBI scale
30:06
that we already know is information and not,
30:09
but we'll just come to it.
30:10
So basically for the sheer way,
30:13
we'll ask you see imaging, how do we do it?
30:17
What is the principle?
30:19
How do we interpret, how do we correlate with FibroScan?
30:23
Andwe? Now what the advantages
30:25
of FibroScan water limitations, uh, or concluding remarks.
30:30
Let's understand the MET V no,
30:34
these are the other scoring systems
30:36
with liver fibro process.
30:38
We are follow met score.
30:40
So this is system used to assess the extent of inflammation
30:44
and fibrosis by histopathological
30:47
evaluation in a layer of biopsy.
30:50
And the grade indicates what this activity
30:54
or the degree of inflammation while the stage represents
30:58
the amount of fibrosis or scarring
31:01
and the grade is the activity.
31:03
So activity, we get the blood tests right?
31:06
And fibrosis is a stiffness that we measure.
31:09
So fibrosis is again on a five point scale
31:12
and activity is on a scale of a zero
31:16
to three, alright?
31:19
Four point scale, okay?
31:21
So fibrosis is F zero to F four, okay?
31:26
Right? And activity is a zero two
31:31
A three activity.
31:34
Alright? So
31:36
accordingly you will have this picture.
31:41
Now all these measurements
31:44
are performed using a software which is integrated into a
31:47
conventional ultrasound machine.
31:49
So which is looking like this,
32:06
okay?
32:06
Alright, so what is a method?
32:11
We will use the sample bots, which is position beamer, image
32:14
of the liver and ELAs.
32:16
Uh, ELA measurements are obtained
32:18
by pressing the button, okay?
32:22
Right? So here we will send in the pulse down
32:26
and by using short it's duration, it's al acoustic pulses.
32:31
This it side tissue of the tissues
32:33
and that generates a micron displacement in the tissue
32:36
and this displacement results in the sheer way
32:39
propagation, right?
32:41
And then the velocity which is of this is tracked
32:44
by ultrasonic correlation based method and is recorded
32:48
and displayed, right?
32:50
So ROI is a blue rectangle which is placed
32:53
at the desired location.
32:54
This is the ROI as we can see here.
32:58
And a standard transducers used
32:59
to apply a ultrasound push pulse
33:03
and that runs alongside the ROI or the area of interest
33:08
because that's the area where it'll capture the velocity
33:12
and it is higher, the most differ the tissue is.
33:15
So the re result tissue
33:17
and compression causes a propagation of the sheer waves,
33:19
the yellow lines, right?
33:22
And the those velocities we will record. Okay?
33:28
Right? These detection pulses can be used
33:32
to calculate the speed of the shearer waves
33:34
and analyzing the return equals right?
33:37
And the speed of the sheway correlates
33:39
with the tissue stiffness.
33:43
Okay? Right? So we've covered this part.
33:49
Now most of the equipments uh,
33:51
currently give the value in both meters per second
33:55
and in kilo basket,
33:57
however you can convert it as well
34:00
if it's not displayed using the um,
34:04
and the, the data, the information
34:07
provided by the equipment and ture.
34:10
And of course as we all know, the stiffer the tissue,
34:13
the higher is the speed, right?
34:16
And we do correlate it with the blood test
34:18
and the score, okay?
34:21
Right? As we all know. Now how do we do it?
34:24
We examine the patient in a spine
34:26
or in the lateral disposition
34:28
and ma arm in later abduction, right?
34:31
And the transfusers located in the intercostal space in the
34:35
viapath lobe.
34:36
So just a summary.
34:39
So optimally patient is fasting,
34:42
patient position is decubitus with the right arm elevated
34:46
above the head for the optimal intercostals
34:49
and do not apply too much pressure on the skin
34:53
resting respiratory position.
34:55
And I always stays beneath the glisten capsule, at least
34:59
keep it 1.5 to two centimeters below so that you
35:04
avoid the reverberation artifacts.
35:06
And of course there's increased, slightly increased
35:09
or higher values closer to the capsule laser,
35:13
a capsular stiffness
35:15
and of course we'll apply, apply the ROI
35:19
avoiding the larger vessels
35:21
and the median value of five to 10 measurements
35:24
is considered and
35:25
and the unit could be either meters per ocular pascal
35:29
and of course we keep the lower standard deviation
35:34
and lower interquartile range, right?
35:36
So we diminish the error in sampling.
35:40
Now there's a question that's formally asked is why do we
35:43
use the right lo we use the right LO
35:46
because um, there's a lot
35:50
of movement in the high left side and the heart.
35:52
So it's very readings very So the fact
35:55
of excess is tissue motion as a secondary
35:58
to cardio pulsation can disrupt the velocity regions on
36:01
the left side.
36:03
So we reason why we do the right lobe but not the left lobe.
36:08
A statistically significant difference is found
36:10
between the shared velocity values in the deep right lobe
36:14
and the deep left lobe, which is 1.2 versus
36:17
one point zeros per second.
36:20
So there is some difference between the velocity
36:24
of the right and the left lobe, right?
36:27
Right. Lobe higher than the left lobe.
36:30
So RIV protect tissue,
36:33
the good part is it's more reproducible when applied
36:36
to the deeper portion of the right lung of the liver, right?
36:40
That's why we do the
36:44
technique we were redone.
36:46
We place the RI then the sample just to summary,
36:50
we have to stay,
36:52
do not place the ROI over the liver capsule, the vessels
36:57
with structure, any of the ligament areas,
37:00
only the liver parenchyma has to be targeted.
37:04
So only the liver parenchyma has to be targeted.
37:07
That has to be, remember
37:11
whenever we press the update key one tissue quantification
37:14
measure is required and we do ask the patient
37:17
to breath hold here.
37:19
Okay? Right.
37:21
So standard measurements at the depth of 2.5
37:23
to five centimes meet and values then calculated, okay?
37:28
And it is the depth not to be more than 5.5.
37:32
Here is a very high tip. That's an error NV sampling.
37:39
Okay? And here, so
37:41
whenever you do not get a reading, it will give you a,
37:44
so it'll not record anything.
37:46
It depends on manufacturer. Manufacturer.
37:48
You just have to need to and to check on your ance can.
37:53
In this case the depth is all okay?
37:55
The regions also looks okay, all right.
37:58
However, it does look a little bit very close
38:01
to the capsule though.
38:02
Okay? Now so then the machine calculates a chart like this
38:07
and gives us to us, we look at these numbers, the median
38:10
and the standard deviation we remember we had
38:13
to keep it less than less.
38:16
Then low 1 20, 30 degrees is better.
38:21
So these are the ways we interpret the results.
38:25
So lesson 1.1 is Patti,
38:27
and this is normal in the fibro process, livers are
38:32
1.32, 1.5, 1.5
38:36
to 1.6 and 1.62 2.0.
38:40
So these are areas of concern that do need to be uh, checked
38:45
and this is how you report and you grade it
38:48
and to be correlated 50 liter and the blood test.
38:53
So it is got more accuracy when
38:57
the values in meters per second can be converted
38:59
to K Ps per the conversion chart
39:01
provided by the manufacturer as per the software used.
39:04
Because that will vary from the
39:07
manufacturer to manufacturer.
39:09
Of course it is only like a sampling it,
39:13
it's not an absolute value, it's just the machines trying
39:16
to capture the stiffness and give it a number.
39:20
Okay? Comparison with the FibroScan,
39:22
which are geal are doing.
39:24
So basically the FibroScan, they are simply,
39:28
they've got this, the patients lying down,
39:30
they just put a transducer uh, on the side,
39:34
it's like a blind procedure.
39:37
So you are not with the ultrasound, it's really targeted
39:40
pinpointing what local area,
39:42
focal area that you're sampling.
39:44
So that is what is being done, but here it is not the case.
39:48
Okay? Right.
39:52
So what are the specific advantages over
39:54
the FibroScan people?
39:56
So this can be done in patients with sitis.
39:59
So a baseline stiffness values obtained in patients
40:02
with signs and symptoms of disease.
40:04
And then what happens? We can monitor it.
40:10
So even in AEs we can do it, we can do it in obese patients
40:14
with severe ptosis
40:15
and post-op patients, patients
40:17
with small intercostal spaces.
40:22
Mm-hmm. And the good part is in the same study
40:26
that you're doing whole abdo scan, you can just do a
40:30
ELAs UDFF all in one go.
40:35
So you can do it in children also.
40:38
You can have a different smaller size probe.
40:40
So it actually makes a good contact along
40:43
through the intercostal spaces.
40:45
And choices depend upon the age of the poverty size,
40:47
higher frequency probe in children less than five years
40:51
and using high frequency probing in children.
40:53
Last for a better analysis of the depth,
40:57
this children is taken between three to five centimeters.
41:01
Again, this is a case as you can see in the A mode,
41:04
the left probe is pretty at enlarged, right?
41:08
And then see here the long ting of the left lower liver
41:13
and the liver also appears scores and stiffness
41:16
and see the velocity value, the velocity value is coming
41:19
to 3.32 centimeters per meters per second,
41:24
which is pretty much high.
41:27
Okay? So these same patient, same images
41:30
but in the color page basically
41:33
using the different filters is all your personal preference
41:36
and it might just accentuate some areas
41:39
that maybe make it easier for you to detect
41:42
and appreciate a pathology.
41:44
Okay? So that's same patient again,
41:46
you have coarse liver left lovis pretty much
41:50
ate LO is also very prominent.
41:52
And then you have the left lobe which has got large
41:57
of the left lobe here, okay?
42:01
Right? You can marry a focal lesion if it's stiff.
42:03
And then how is the status background level?
42:06
This you can't do in FibroScan you can only do
42:08
an ultrasound, right?
42:10
So here there's a large lesion that's there in the liver.
42:15
The clinician wants to know how is the status,
42:17
the background level and then
42:20
accordingly they want
42:21
to make a call whether it we do just remove the lesion
42:24
or we remove the whole liver
42:26
or to plan something differently.
42:28
So when you do the astro of the left lobe,
42:31
there's specifically status of the left lobe
42:34
because right, they'll probably remove completely.
42:37
So here we can do selective assessment of particular lobe
42:41
or a segment also, right?
42:44
So here the values are of course it's three point,
42:48
one point, it's four, 1.5, 1.5,
42:51
not too high at least reasonably, alright, right?
42:54
So this is an added advantage.
42:56
You obviously have to take that value, store it
42:59
and then maybe do a reentry of the patient because
43:01
otherwise if you take all
43:03
of them together they will all get merged into the final
43:06
report that you're calculating.
43:09
So this is the affected area sampling,
43:11
which is obviously higher, 3.06, 2.87.
43:16
Okay? Alright.
43:18
So 2.48 is the stiffness
43:20
and of course we look at the standard division IQR
43:23
one is less than three, which is good
43:26
but could have been better.
43:27
We can check if there is any scope,
43:29
any erroneous reading which is out of the room a lot.
43:33
We kind of discovered delete that reading
43:35
and free do another one too.
43:37
Complete set of 10 right?
43:40
Now here's a case, there's a focal had at cyst lesion,
43:43
which is classy that you can see.
43:45
We want to assess whether this patient really needs a
43:48
transplant or is all right.
43:50
Right? So here we are going
43:52
to sample the background chy the background parent showing
43:55
1.9, 1.9.
43:57
So kind of reasonably, all right, not to back, okay?
44:02
So to summarize, elastography is inexpensive, safe,
44:06
reliable, and it's non safe.
44:09
There's no, there's no rule book
44:12
that this is the right way to do.
44:13
The ELA not whatever, what's best for you, you can do it
44:17
however you have to remember
44:19
after that is not reliant in patients
44:21
with atrial right lobe patients who cannot hold their breath
44:24
and there's this excess infectious center when the liver is
44:27
not only seen very well, what can you really do much, right?
44:32
We already talked about the sensitivity
44:34
and atory literature.
44:37
Obviously the technology has more sensitivity
44:41
and specificity at higher level
44:43
of liver pathologies, cirrhosis, right?
44:46
And the other one, right?
44:48
So what does journal of medical ultrasound say again?
44:51
The data they have calculated
44:53
and they've said that of course it is a good procedure,
44:57
it's a targeted procedure.
44:59
It work on those shortcomings at the uh, fibrous scan there,
45:04
the problem only position randomly
45:06
and use a plan they could advers.
45:08
So we can readily use it
45:10
with a ultrasound machine guidance, right?
45:14
Elective assessment and hepatic segment of condition
45:16
as possible and find it's a, compared with the score right
45:22
now it can be an all in one or you can put the ROI
45:26
and then it will give you the value.
45:28
Now this is going directly in the unit code KBA
45:32
here 70.
45:36
Now you can also do the elastic of the spleen.
45:41
You can see the velocities there, okay?
45:48
Right? And then we have a liver which is
45:52
cores, heterogeneous, maybe the ations as well.
45:57
And we do the uh uh, we do the elastic
46:02
and look, we have a good sample.
46:05
Now this, its itself
46:08
with good breath holding is a very complete diagnostic.
46:11
So each of the tracers is got all the four lights blowing.
46:16
So that means everything is done correctly.
46:19
The patient holding play.
46:21
And we were to three see well and analyze.
46:25
So this one value is quite representative
46:30
of the parenchyma and the way it just been assessed
46:33
and we could reli it.
46:34
However, you can take multiple readings.
46:36
So 3.7 is what it was 3.6.
46:40
And again 3.6 here again.
46:42
So whatever has actually been sampled has been
46:45
sampled accurately.
46:47
Whatever was not sampled, we do not, no.
46:50
Again, another one very well sampled.
46:53
So which is again showing consistency of 3.04.
46:59
Okay? So this is how it's giving us all the 10 sites, 10,
47:02
15, size four each one that we have assembled.
47:06
And accordingly we get a kidney.
47:08
Uh, K mean KPA value that you get document.
47:14
Thank you so much for your wonderful listening. Thank you.
47:17
And if there are any questions, I'm more than happy
47:20
to take them now.
47:23
Thank you so much for another great lecture.
47:26
Appreciate that. We will open the floor for some questions,
47:31
so if you've got them please put them
47:32
into the Q and A feature.
47:34
Yes, Dr. Sal, if you're able to open that up, I can start
47:37
Us off. I've done that. Yes,
47:38
you got it. Okay.
47:39
So the question number first is do you get 10 measurements
47:42
randomly in the right hepatic flow of choosing the area?
47:45
Yes I do. Or do you set one area
47:48
and get one measurement, then set another area
47:50
and get another measurement until you reach 10?
47:52
So basically I do all in the right low.
47:55
I would little bit move not in one particular area,
47:58
but I would just move around the area so
48:00
that way I've actually sample the poor liver
48:02
and if there's a particular path area that has any pathology
48:05
or assisted relation, I would avoid that area
48:08
because we are trying to get the sample
48:10
of the diffuse liver.
48:13
Okay, so IQ I QR is an interquartile range.
48:17
It's another parameter of standard deviation and statistics.
48:21
So which indicates that the values are lined
48:25
or out or erroneous.
48:27
So we try and keep that value low.
48:31
Spleen elastography uses OID malignancy and experience.
48:35
Any literature that you would suggest?
48:37
I'm sure there are many papers and
48:38
spleen elastography coming up.
48:40
We are doing routinely, uh, liver and spleen both
48:45
and they both have a role in prognostic, uh,
48:49
and diagnostic uh, management of these patients.
48:52
So they say more urg and more heis
48:56
and more, uh, there are, there is,
49:00
it's it's it's an evolving thing.
49:02
There's a thesis paper also going on
49:05
and definitely it is very helpful.
49:08
Any experience in thyroid strain?
49:10
Elastic probably with thyroid correlation.
49:12
But of my favorite questions, I do a lot
49:15
of work in thyroid scoring.
49:16
I've been invited faculty for an endocrine conference
49:19
but for the thyroid conference in
49:22
um, uh, Dyson.
49:25
So the thing is the thyroid, I do not go with asto
49:29
because thyroid has calcifications often
49:32
they're not used with hap.
49:34
So whenever it is calcification,
49:36
so the stiffness will obviously go up.
49:39
So it's really not that a criteria.
49:42
Elastography is good for lymph nodes, definitely to
49:46
evaluate whether the lymph nodes are
49:48
metastatic or non METAS status.
49:49
That's an area where you could technically apply them in the
49:52
neck, but applying them
49:53
for thyroid nodules hasn't been very rewarding.
49:57
It can be rather, um, misleading
50:00
and uh, take you away from the diagnosis.
50:03
So I would rather just apply the res feature
50:07
and by their size
50:08
and criteria suggest for a biopsy
50:11
that would be better in patient management.
50:14
Thank you. Next, is there any advantage
50:17
with AFI over another ultrasound machine
50:21
which incorporated FibroScan into the ultrasound machine?
50:25
I think lips, um, I'm mean gastro departments,
50:28
gastro department, ultrasound ultrasound department.
50:32
So we have our machine which will do our liver abdominal
50:35
scan and um, uh, liver abdominal scan,
50:41
which will do the liver abdominal scan
50:42
and the ELA graphic together.
50:45
So I need a machine which will do my work of
50:50
evaluating the focal heep lesions very well,
50:52
do the hepatic doppler also very well and do all my work.
50:56
So I mean I'm, I'm blessed
50:59
to use a very high end Siemens machine
51:01
so which gives me great shoot resolution
51:04
and that's where most of the work is being done.
51:07
Thank you. Um, uh,
51:10
Philip E 50 is the good.
51:13
We'll have to check with somebody
51:14
who's using that equipment.
51:16
Uh, we are on Siemens predominantly. Thank you.
51:21
Okay, so which uh,
51:24
ultrasound machine have this graphic software?
51:27
I mean I've already answered.
51:29
Most of the, most
51:30
of the machines today have anela graphic feature.
51:33
Okay. So most of them have
51:37
any points in UDF in heterogeneous fatty infiltration
51:40
of your, of course you can do it in that as well.
51:43
You are going to take random sampling so and will aggregate.
51:47
So even if there's a heterogeneous fat infiltration, um,
51:52
you take more values than you have reached them out.
51:55
Thank you. Uh, is there a name to the S zero S one rating
51:58
of liver attenuation fat quantification?
52:01
Basically zero is normal.
52:04
One, two and three are mild, moderate weight and severe.
52:07
Okay, so done.
52:11
And um, next is, uh,
52:15
can it be used in breast imaging?
52:16
And it's to read, you know, what imaging, yeah,
52:19
of course elastic is used in breast imaging
52:22
and lymph node imaging.
52:23
Yes, it is being used.
52:25
Um, to what extent is a question, uh,
52:29
but yes it has being used is MR in liver,
52:33
unless there more is more details
52:36
and you see, I mean MRI is good,
52:39
but ultra ultrasound is so easy, convenient,
52:41
and it's just one stop solution
52:43
and you have the transducer, it's just done in two minutes
52:46
and way better see
52:50
how many hours fasting
52:51
for deliver the last two roughly four hours.
52:53
Two to four is good, include water, water,
52:57
water patient can have.
52:58
So basically no food, water is okay.
53:02
Okay, so next
53:07
is, this is done.
53:09
We are doing ary a blast.
53:11
We believe this is different from rrp.
53:13
I have some experience with Siemens RRP as well.
53:17
Yes, I mean Siemens RP is good. We are doing ela.
53:20
Both are good. We, I've also done both of them, both good
53:26
role in endometrial carcinoma.
53:28
I haven't applied it, I haven't applied it.
53:31
And so basically it's just the gray scale features, the size
53:35
and the criteria and then suggestions to pathology.
53:40
Thank you. Thank you so much for all your questions.
53:44
Very wonderful interacting with all of you.
53:47
And thank you for your questions,
53:49
which made it very interesting and very exciting for me.
53:52
I've thoroughly enjoyed it. Thank you.
53:55
We enjoyed this so much Dr.
53:57
Singal, thank you so much for coming back
53:58
and sharing your expertise with us.
53:59
We love having you on
54:01
and thanks for everyone else for participating
54:03
and asking such great questions.
54:06
You can access a recording
54:07
of today's conference in all our previous noom conferences
54:09
by creating a free account.
54:11
We'll also email out a link to the replay later today.
54:14
Be sure to join us next week on Thursday,
54:16
July 10th at 12:00 PM Eastern, where Dr.
54:19
Steven Pomerance will deliver a lecture entitled practical
54:22
Aspects of post-op Spine imaging and reporting.
54:26
You can register for that@mrionline.com
54:28
and follow us on social media
54:30
for updates on future NOOM conferences.
54:32
Thanks again for learning with us and have a great day.
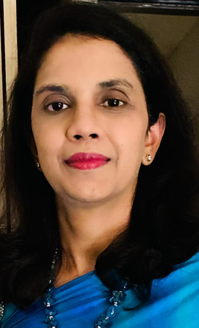
Alka Ashmita Singhal, MD
Associate Director Radiology
Medanta Medicity Hospital Delhi India
© 2026 Medality. All Rights Reserved.
